SignalRank Upgrade to v2 Brings Significant Improvements.
300% improvement in unicorn discovery over v1
What Have we Done?
When I wrote “What is SignalRank?” in January of this year I reported on v1 of our model:
The live model performs very well. As noted above, it produced 1,127 recommendations between 2012-2022, of which 234 are currently unicorns.1
Now, nine months later, we are announcing v2 of our model.
Context
There were over 19,000 Series B rounds from 2012-2023. 1,787 became unicorns, with an average multiple across all Series Bs of 2.9x at the year 5 point after the B round. If it were possible to index Series B Rounds then this index would be in the top 5% of all venture investors at that stage. To put it another way, most VC funds do worse than the market as a whole. This is due to the power law, where a small number of funds make large returns from an even smaller number of investments. To be better than the market a fund needs to have made power law investments. The table below shows all 2012-2023 Series B’s and their performance by year.
SignalRank v2
In a similar back test to that conducted for v1, the v2 platform selected 2,612 companies and of these produced 639 investments in companies that became unicorns. A 316% improvement over v1. 639 is 35% of all unicorns that emerged from all Series B rounds in the market as a whole. Below is the table for the v2 back test, showing all selection statistics.
Comparison, v1 and v2
The upgrade improvements to v1 are multi-dimensional.
Firstly, SignalRank v1 was highly tuned to find positives (good performance) and was more relaxed about missing some. That left lots of “false negatives” - good companies that failed to meet the v1 criteria.
The goal of v2 is to turn those false positives into actual selections, thus growing the number of companies qualifying, growing the number of unicorns, yet maintaining the quality of the MOIC delivered.
By expanding the set of qualifying candidates we then grow the number of seed investors we can partner with for their pro-rata, without reducing performance.
The current v1 back test selects 858 companies since 2012. v2 selects 2612.
v1 has an average MOIC of 4.6x 2012-2023. v2 has 4.0x. 2012-2023.
v1 has 203 unicorns from the 858 selections (26%) v2 has 641 from 2,612 selections (24%)
This means we have significantly grown the candidate base while maintaining excellent performance.
The scalability of v2 is the key gain and we have more than met our primary milestone. Against the endgame goal of creating a public index of the best Series B rounds, v2 enables a highly executable operational path.
v1 and v2 2012-2019
Taking 2012-2019 as a reasonable year range here are the numbers in charts:
Chart 1 shows that v2 was able to confidently recommend 1,503 rounds from the 11,500 rounds between 2012-19. 13% of all rounds. v1 only recommended 420.
Chart 2 shows that despite selecting over 300% more rounds v2 was able to perform at a high standard. It does not beat v1 in this metric, but relative to having 300% more recommendations it seriously outperforms the Series B market number of 3.6x for the same period. Our measure of success is to beat the market with a small percentage of the rounds selected.
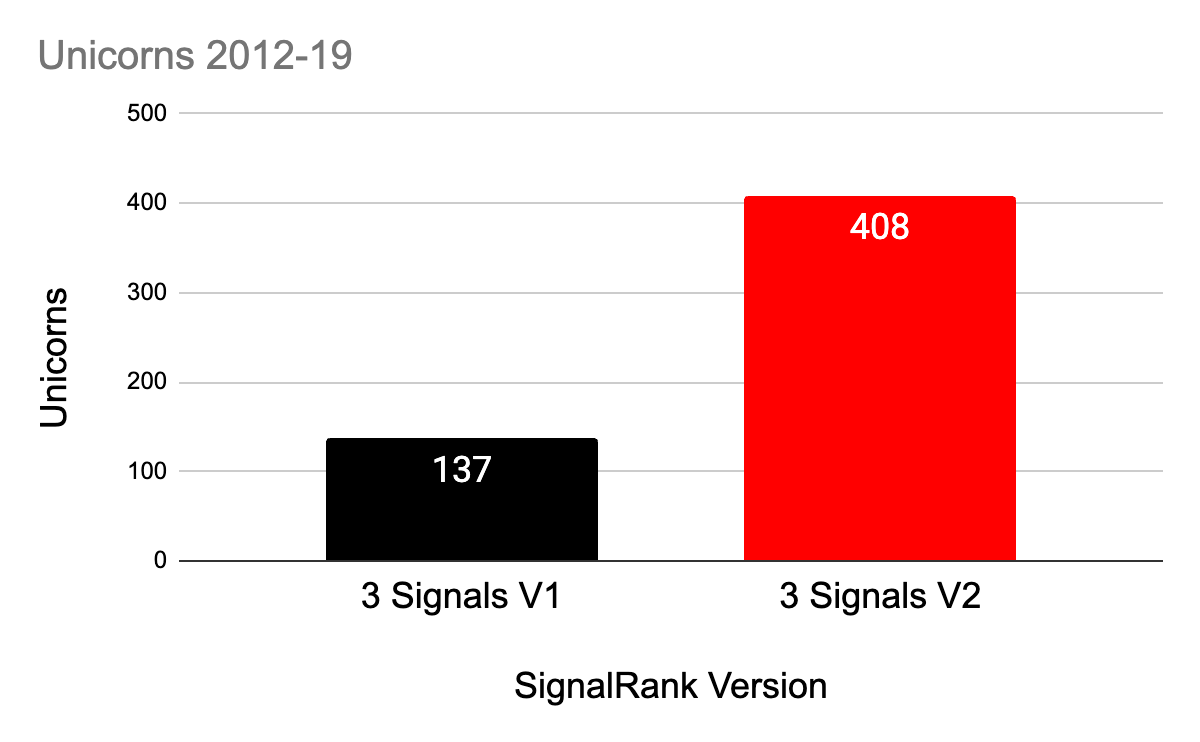
Chart 3 simply measures how many unicorns emerged from the recommendations. This metric is not close. v2 is better than v1 by almost 300%.
Chart 4 is similar to chart 3 but measures the % of all recommendations that become unicorns. Again v1 wins on this metric, but at 300% more recommendations v2 is still able to average 27% unicorns in a market where 10% (10.87% in this range of years) is normal.
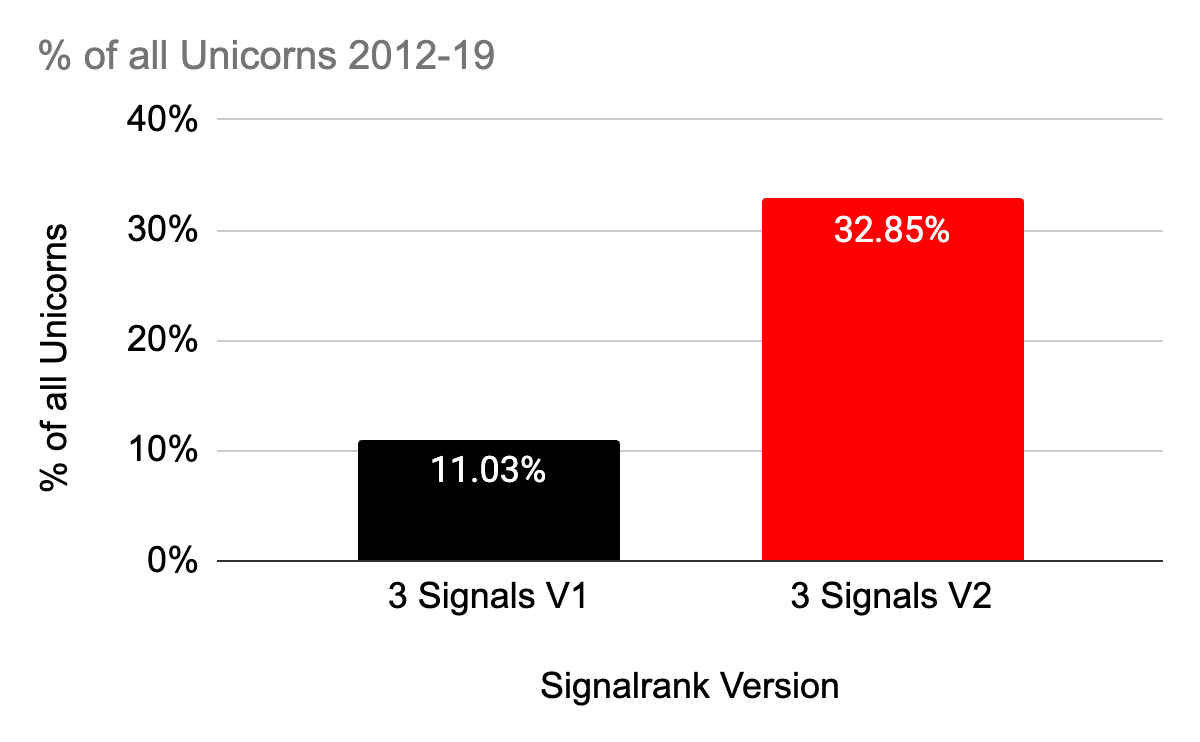
Chart 5 looks at the percentage of all unicorns that emanated from Series B rounds in the 2012-19 period and asks how many of them the algorithm found. v2 is many times better than v1 as you can see.
The final chart, Chart 6, measures what percentage of all Series B rounds could be selected by the algorithm. v2 uses a threshold scoring system (targeting a certain percentage of rounds in the top quartile). The current version targets a 15% threshold. That means the round score must be in the top 15% of all rounds scored. In practice it recommended 13% against this target. v1 could only select 3.65%.
So there you have it. Our Series B recommendations are now using v2 of the algorithm. We have found hundreds of rounds that were previously not found, many of them unicorns. We continue to iterate and improve. Our machine learning model mentioned in the first newsletter is now at an advanced stage of development and will soon be ready for backtesting.
Significant By-Products of v2
The methodology to build v2 has been in development for the past nine months and has some significant by-products for our investors. We now score all investors at all rounds. And so we also score all rounds, not only Series B. A company also builds a company score across its rounds, enabling us to compare all companies at any round.
The hierarchy is as follows:
This means that SignalRank is now capable of predictive outcomes at all round stages.
Back tests show significant correlation between recommended companies at seed through Series D and the outcomes of those companies.
Our investor portal will soon have filterable recommendations across all of these rounds.
Notices
We are compelled to note that future performance cannot be assumed from our back tests and that only accredited investors making their own diligence should consider an investment in SignalRank. This newsletter should not be taken to be giving investment advice.
v1 has iterated through the last 9 months and it currently back tests at 858 selections and 203 Unicorns. These numbers are used here.


