SignalRank's scoring algorithms aim to align our investments with our partner's greatest chance of seeing returns on their investments. We seek to provide capital for the best prospects within their portfolio.
Because our partners share profits on our investments, they have a common interest in the quality of the companies we place capital into. Our scores are intended to weigh all Series B rounds against each other. We target the top 5-10% of high-scoring rounds. In that sense, our accuracy is of significant interest to our partners.
Last October, we announced version 2 of SignalRank's algorithms.. At that time, we highlighted a significant improvement in the algorithm’s ability to detect companies likely to achieve a 5x MOIC (multiple of invested capital) or more within 5 years of their Series B funding round, while maintaining strong unicorn prediction capabilities.
While version 2 showed relative performance metrics slightly below version 1 (24% unicorns vs. 26% and 4x MOIC vs. 4.6x MOIC), it demonstrated substantial absolute gains (641 unicorns vs. 203), making it far superior in overall performance. Here is what we said at the time. These were 2012-2023 numbers so included many immature qualifiers.
v1 has an average MOIC of 4.6x 2012-2023. v2 has 4.0x. 2012-2023.
v1 has 203 unicorns from the 858 selections (26%) v2 has 641 from 2,612 selections (24%)
This means we have significantly grown the candidate base while maintaining excellent performance.
With version 3, these performance metrics have improved even further, as evidenced in the following charts. We focus on four dimensions of improvement:
1. Number of Qualifiers: Ensuring sufficient candidates to produce at least 100 investable Series B rounds per year.
2. Average and Median MOIC: Evaluated through backtesting.
3. Unicorn Percentage: The proportion of unicorns produced by the backtest.
4. Absolute Number of Unicorns: The total count of unicorns identified.
No single model excels in all four dimensions, but MOIC production and the number of qualifiers are the most critical as they directly impact the number of accessible Series B rounds and the likely performance of those investments.
Version 3 outperforms both version 1 and version 2, producing more qualifiers, a significantly higher average and median MOIC, and a much higher unicorn percentage.
To correlate performance to the age of the investments in the qualified companies, we will use 2012-2020 as the range of years tested and compared.
This permits us to include 2021-24 performance in investments made up to 2020, and so shows a realistic set of outcomes.
For 2012-2020 here is the comparison:
It is clear that v3 has performed by optimizing qualifiers to provide at least 100 annual qualifiers (v2 produced too many), increasing MOIC against v2, and unicorn percent against both previous models. v1 produces better MOIC but at the heavy cost of too few qualifiers and as a result a low absolute number of unicorns.
First - Average and Median MOIC at Year 5:
This is an average of 5.62x MOIC at the 5Y point across 2012-2020 (and almost 14x all-time MOIC. The Average of the Median MOICs is 2.22. Compare this to all Series B Rounds:
The most striking difference is in the median results from all Series B (no value growth).
We assess the algorithm's performance using True and False Positives (where we predict a 5x MOIC at the 5-year mark) and True or False Negatives (where we predict a failure to reach a 5x MOIC at the 5-year mark).
The chart shows that with a goal of 5x MOIC at the 5-year mark, we achieved 87% accuracy in predicting a failure and 30% in predicting success.
We can also see the rate change if we plot against other target MOICs.
The x-axis here has a target MOIC, and the y-axis shows the percent for True Positives and False Positives. For example, if we target a 7x MOIC, the True Positive percent would be 21%. Or a 10x MOIC in 5 years would have a 14% accuracy. If you click through to the live chart you can hover over the values to see the full analysis at each point.
Although obvious, a 21% success in predicting a 7x MOIC in 5 years is very good.
Measured by traditional data science criteria, we achieved 82% accuracy, 29% precision, and 16% recall, with a 5x MOIC in 5 years target. In data science, accuracy is the ratio of correctly predicted observations (both true positives and true negatives) to the total observations, giving us an overall performance measure of 82%.
Precision, at 29%, reflects the proportion of true positive predictions among all positive predictions, indicating the ability to correctly identify successful investments. Recall, at 16%, measures the ability to capture all true positives, representing how well we identify all potential successful investments.
The chart below visualizes these metrics, with precision and recall represented in red and black bars respectively, and overall accuracy shown in a taller red bar, indicating a significant achievement against our goals.
Second - Unicorn Prediction
The best we could achieve under v2 was a unicorn prediction rate of 24%, compared to 26% in v1. Those are already excellent results compared to the average of 10% in Series B.
In V3, we have achieved over 30% average success in unicorn prediction.
We have also done this without reducing the qualifier count. v1 had 478 qualifiers from 2012-2020, v2 had 1738, and v3 has 959. (see below for chart)
This is significant because it has many benefits, such as v1 (high unicorn performance) and v2 (high MOIC performance). Version 3 qualifies between 140 and 160 Series B rounds yearly for SignalRank (2012-2020). Our short term target number of investments per year is 30. We can predict with high confidence intervals achieving our average outcomes from as few as 10 rounds a year.
How did we do it?
The improvement of v3 over prior versions has two key drivers.
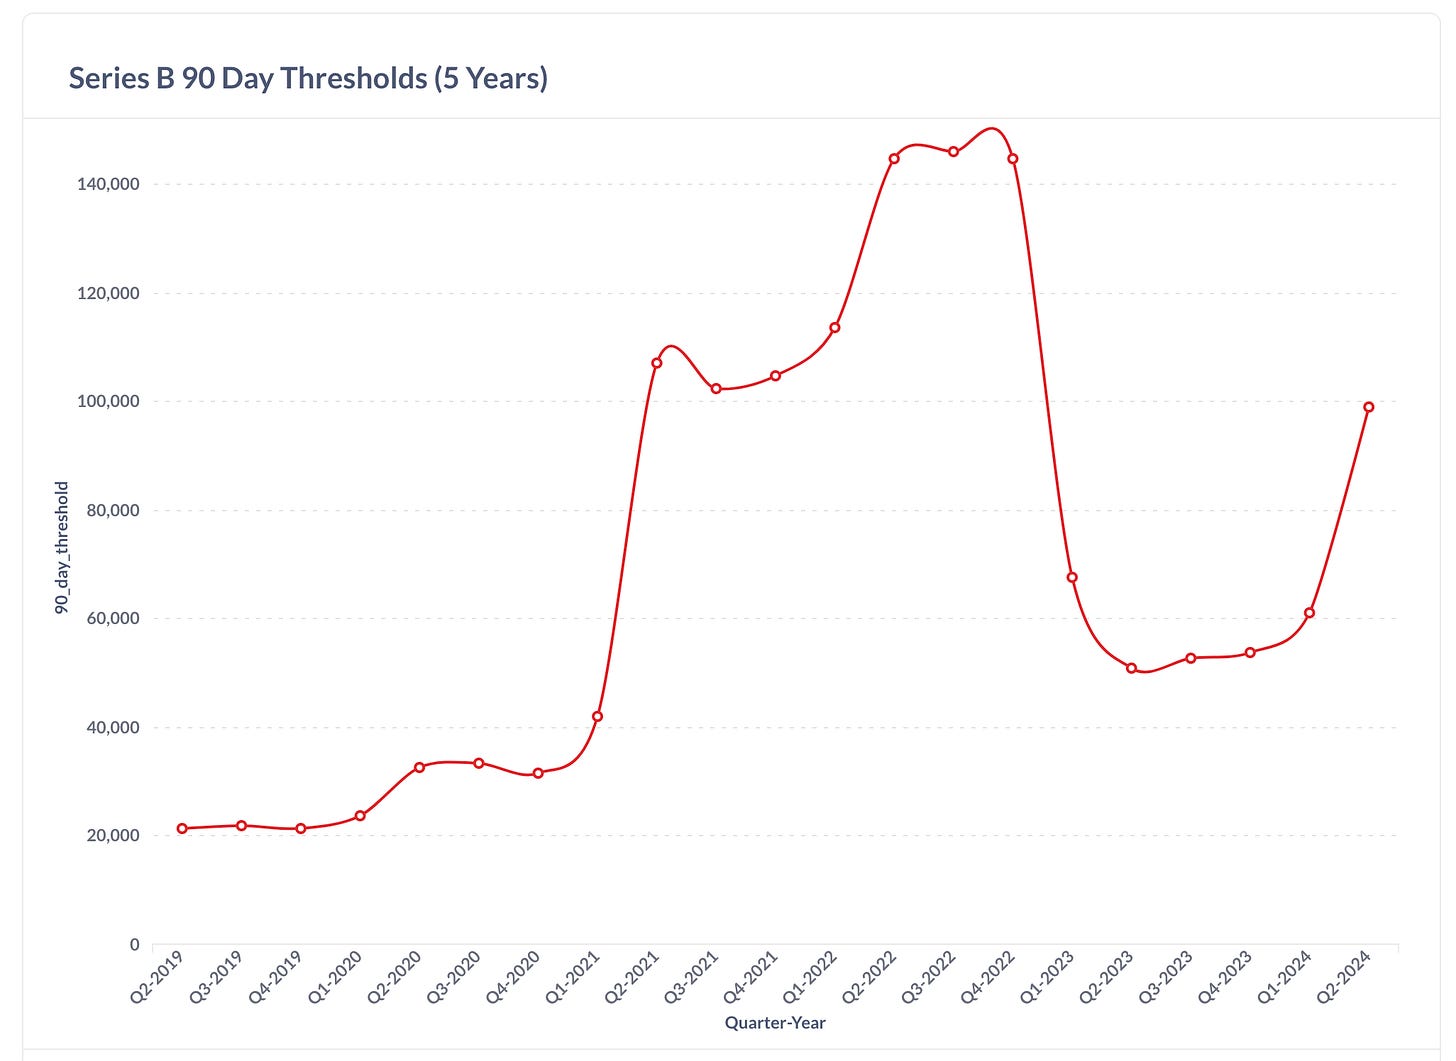
The first is 'Thresholds'. A threshold is a score a company must achieve at Series B to qualify as a SignalRank index qualifier. Previously, the thresholds were less granular. They adapted to market conditions but were less responsive. Now, they adapt daily from a short window of 90 days. The model is very dynamic with the market. The chart shows how it becomes harder to unlock our capital when the market is "hot."
The required score is on the Y axis, and the last five years are on the X axis by quarter. The required score escalated rapidly after Q4 2020 as investors became less disciplined and reduced by Q1 2023 as the market corrected.
We have also developed two additional measures: performance gains over the threshold and the distribution of scores across all funding rounds up until series B. Our trade secrets are buried in all of this, but the result is higher MOIC performance in our backtest and many more unicorns.
The second innovation underlying these results is that we now have many more scoring tiers that map to the power law characteristics of venture investing. Without too much detail, the difference between good and modest scores is now more pronounced. That correlates to more true positives and more true negatives.
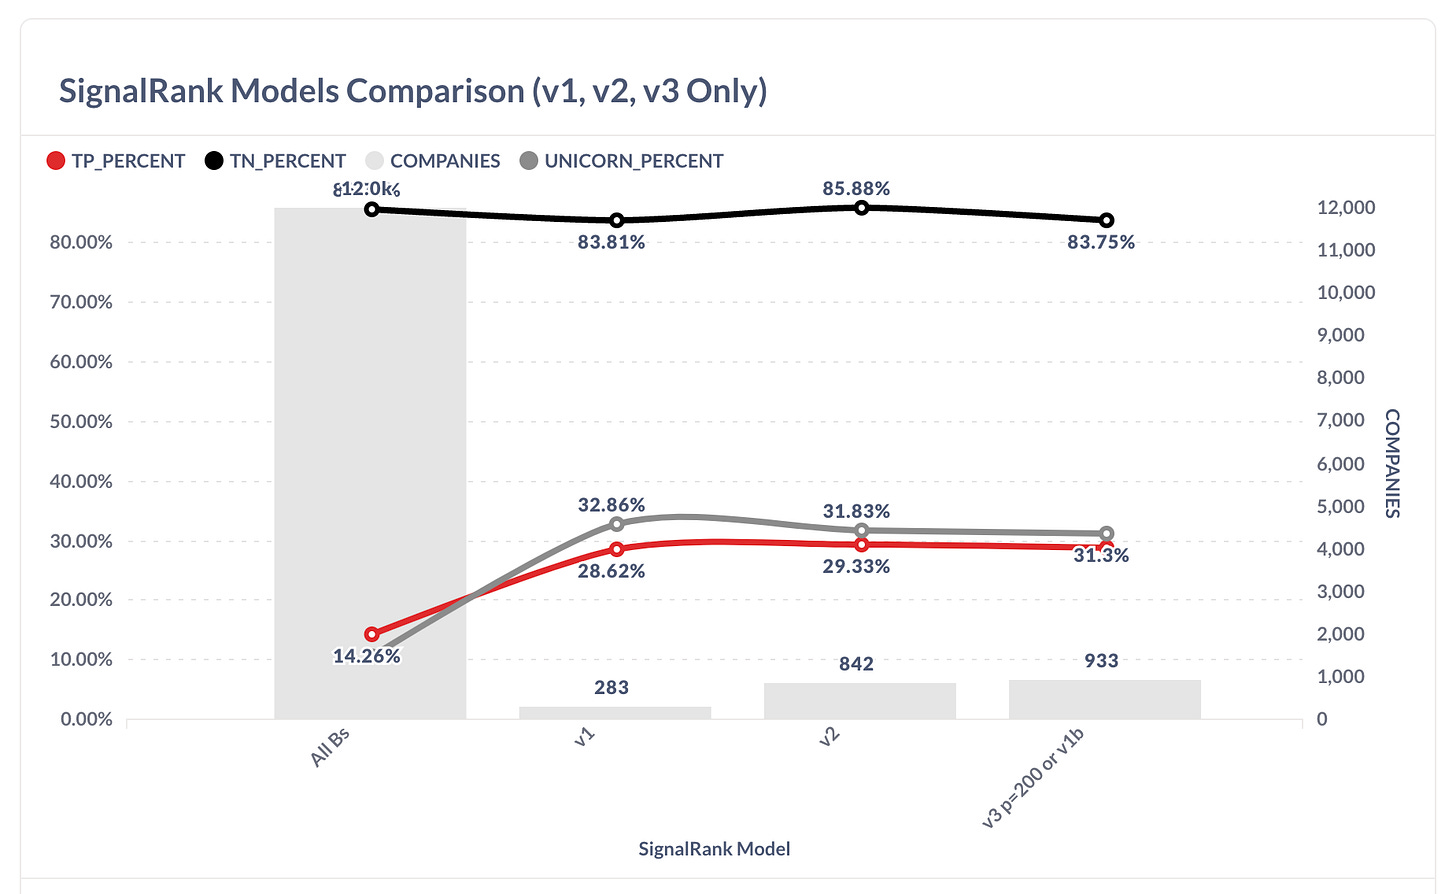
Internally, we run many more models, including a full AI model that predicts MOIC. As the next chart shows, all perform far better than the market average.
Our models are shown along the x-axis, and the y-axes shows the performance criteria. The gray bars show the number of qualifying Series B rounds the model produced from 2012 to 2020. The tall gray bar shows all Series B rounds.
The model we call v3 is depicted here as 'v3 p=200 or v1b' on the x-axis.
To simplify, we limited the first two charts to the algorithms v1, v2, and v3. The third has all of the models we run.
SignalRank has completed 13 Series B investments (soon to be 15) with our seed partners. The total number of qualifiers since we began investing in May 2023 is 121 as of 5 June 2024, so we are invested in about 12% of the qualifying rounds.
SignalRank is the third most prolific Series B investor into the 121 qualifiers and in the top 10 for all Series B Rounds since May 2023.
Based on capital availability, we want to increase that to nearly 100% over time. Our short-term target is 30 Series B rounds annually. The 2024 target is 20. Our current average check hovers around $350,000. Our goal is to grow that to $5m.


