

SignalRank releases v4-ensemble-model to production.
Large uplift in companies and performance over previous v3-model.

SignalRank is an index of private venture backed companies at Series B, currently 35 of them. Access is available via SignalRank share purchase to accredited and qualified investors.
In the 24 months since our initial investment, SignalRank has deployed capital across three annual cohorts, 2023, 2024 and the in-progress 2025 cohort. The 2023 and 2024 cohorts have already achieved a 1.2x multiple on invested capital (MOIC) placing them in the top decile of venture performance (per Carta data).
The value of SignalRank’s preferred shares has risen to a price of $27.09 a share, having seen four price increases over 24 months due to multiple company up-rounds.
SignalRank selects Series B investments through a scoring system that identifies the top 5% of opportunities. The newest version, v4-ensemble-model, enhances the previous heuristic-only method by incorporating machine learning into an ensemble framework.
The model scores every Series B round as it happens and is designed to predict likely outcomes. It targets a five year MOIC of 5x as its definition of “success”.
v4 is based on a new three year scoring paradigm, a change from the five year horizon used in v3. This means we have fine tuned the heuristic part of the model to score investors on three years of investments and outcomes for every round type. This refinement focuses on more recent investor performance trends.
Selection
v4 selected more and rejected fewer companies than the prior model while improving performance.
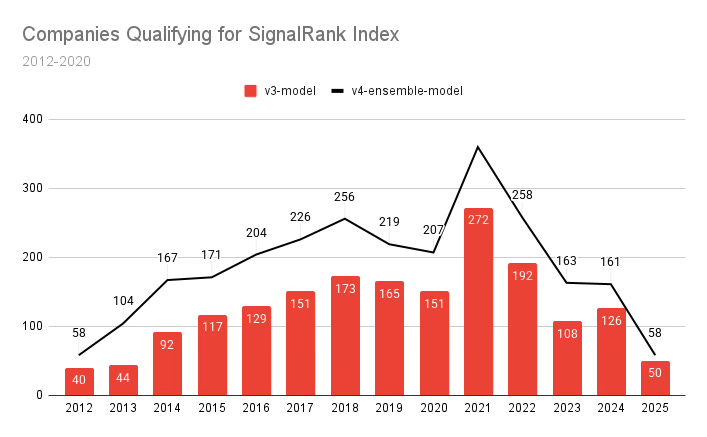
The new model rejected 9,732 of 11,344 Series B rounds between 2012-2020 (the backtest). It was 86% accurate in predicting those 9,732 companies would not achieve a 5x in five years MOIC performance. The prior model rejected 10,282 and was 83.5% accurate.
This means that v4 accepted 1,612 selections as qualifiers as compared to 1,062 for v3. That is 52% more investable companies without the cost of reduced performance.
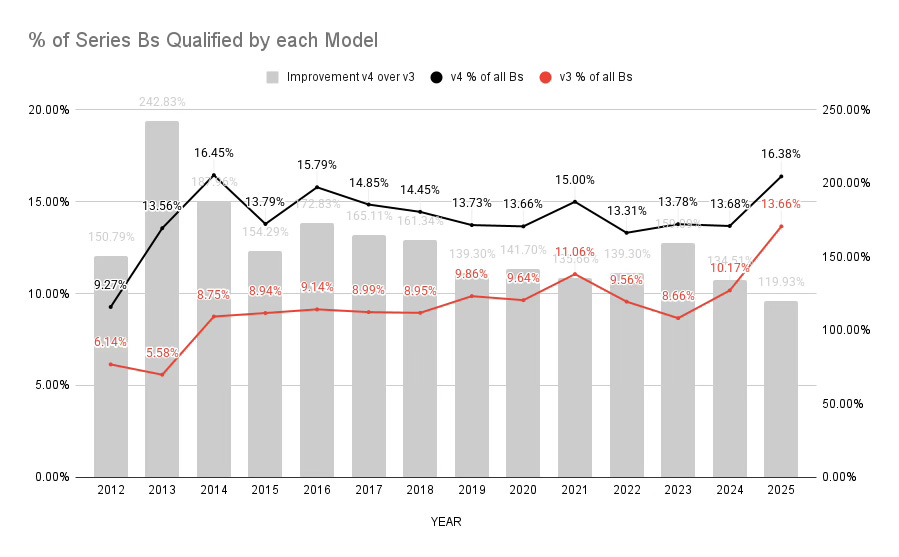
v4 is 28.9% accurate in selecting companies that deliver 5x or more in five years, compared to 27.9% for the prior version. v4 generated 466 companies over 5x in five years as compared to 296 from v3 in 2012-2020.
Take Away: v4 selects more companies and they perform better.
Reference: v4 backtest
Business Performance
MOIC
SignalRank measures performance by both business metrics and data science metrics. Business metrics relate to outcomes from invested capital. Data science metrics are about statistical probabilities and performance against those.
Lets start with business metrics. The business metrics are all about returns, measured in MOIC.
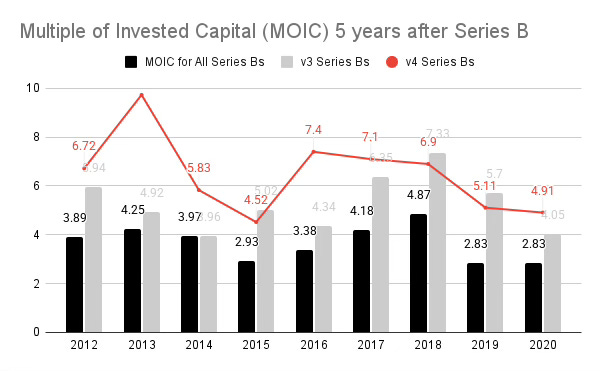
v3 has a 2012-2020 average of 5x, which is excellent by any standards especially when compared to the average of all Series Bs of 3.7x. v4 improves on this with an average over the period of 6.5x.
Median MOIC is is some ways more important due to the power law characteristics of venture investing. Median MOIC for all Series Bs is equal to 1. Literally this means you do not make money.
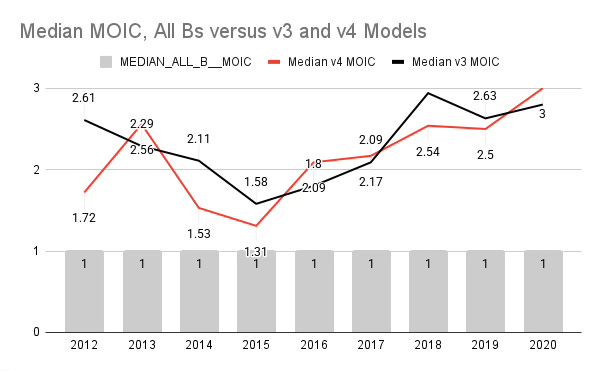
The median MOIC for v3 is an average of 2.3. For v4 it is 2.2, indicating that the improved average performance of v4 is not bought at the expense of a meaningly lower median.
Unicorns
Measured as a function of the number companies that go on to be unicorns, v4 also outperforms v3.
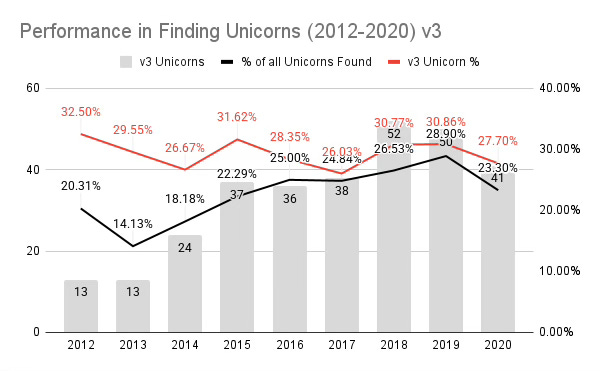
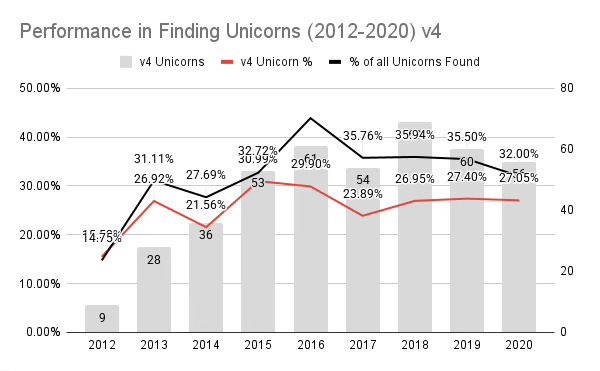
Unicorn generation
v4 finds 426 unicorns, averaging 32% of all unicorns produced, and 26% of all qualifiers.
v3 finds 304 unicorns, averaging 23% of all unicorns produced, and 29% of all qualifiers.
Data Science Metrics
Data Science measures the performance of a model using the following measures:
True Positive Outcomes - This is where a qualifier equals or beats the 5x in five years target.
True Negative Outcomes: This is where a qualifier fails to equal or beat the 5x in five years target and was predicted to fail.
False Positive Outcomes: This is where a qualifier fails to equal or beat the 5x in five years target but was predicted to do so.
False Negative Outcomes: This is where a qualifier equals or beats the 5x in five years target but was predicted to fail.
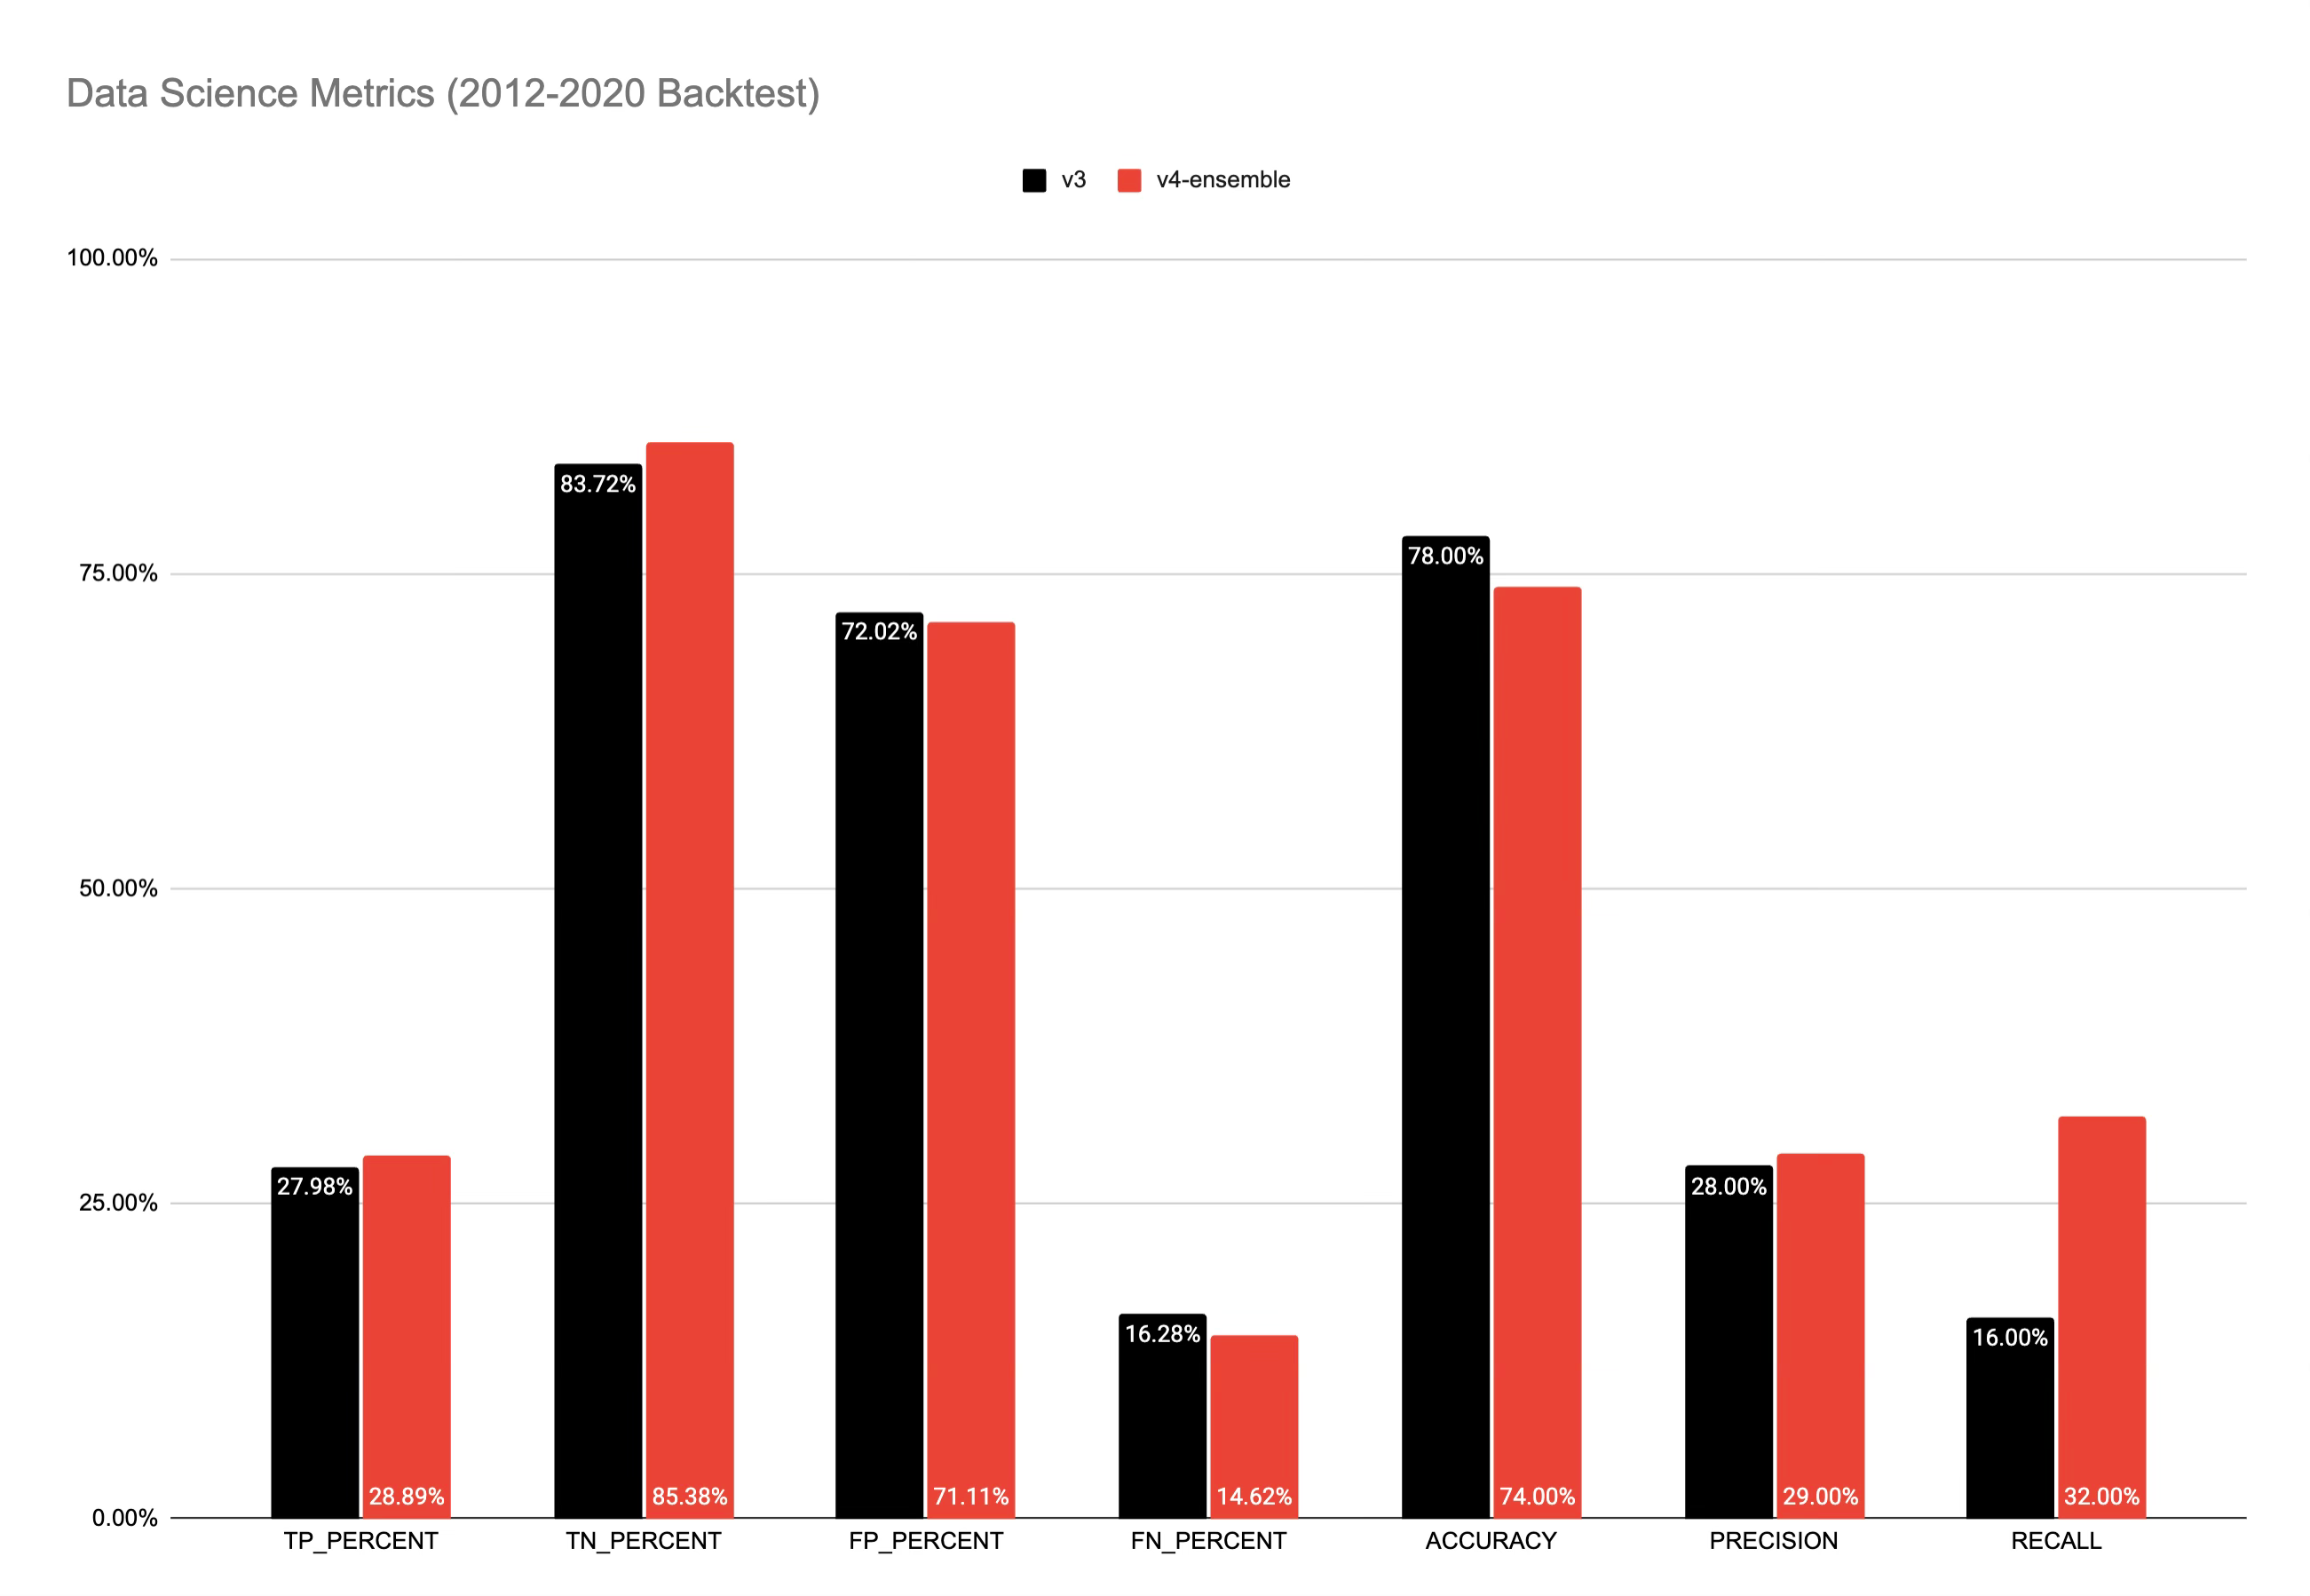
For the v3 model these were:
TP: 202 (correctly predicted worth 5x)
FP: 520 (incorrectly predicted worth 5x)
TN: 5,420 (correctly predicted not worth 5x)
FN: 1,054 (incorrectly predicted not worth 5x)
This is an accuracy of 78% and a precision of 28% and a real rate of 16%
For the v4 model these are:
TP: 401 (correctly predicted worth 5x)
FP: 987 (incorrectly predicted worth 5x)
TN: 4,906 (correctly predicted not worth 5x)
FN: 840 (incorrectly predicted not worth 5x)
This is an accuracy of 74% and a precision of 29% and a recall rate of 32%
v4 outperforms v3 in both recall and precision, which are more critical than accuracy for venture investing.
Recall
Recall is a key number - Recall is the percentage of companies selected that actually became "5x winners"
For the v3 model, the recall is 16%, meaning:
It only correctly spotted about 16% of the companies that eventually hit the 5x return threshold
It missed 84% of these successful companies (false negatives)
For the v4-ensemble model, the recall is 32%, meaning:
It correctly identified about 32% of the companies that ended up as 5x winners
It still missed 68% of these successful companies, but that's a significant improvement over v3
Higher recall means fewer "missed opportunities" - those potentially lucrative investments that the model incorrectly predicted would not reach the 5x threshold. Overall both recall and precision are important and v4 beats v3 on both.
Operational
v4 is now operational and being used to qualify companies of our partners for Series B investment. The improvement is expected to lead to more investments with improved performance.