


How to value a listed VC index
Premium assets attract premium valuations

Investors will pay for quality. This is as true in public markets as in the private markets.
In this post, we first consider how the public markets share a similar dispersion of returns as seen in the private market. We see how quality assets command premia to the rest of the market. We then consider how a similar dynamic occurs in the private market, and how scarcity of access can even drive valuations beyond Net Asset Value.
It goes without saying that listed entities without quality assets trade at a discount to NAV.
Power laws in public markets
The P/E premium of the Magnificent 7 (Meta, Amazon, Apple, Microsoft, Alphabet, Tesla & NVIDIA) over the remaining S&P 493 has been consistently above 40% since 2018, and at times as high as 100% (Figure 1).
Figure 1. Goldman Sachs analysis on Magnificent 7 vs S&P 493 (May 2025)

This is not surprising given that Morgan Stanley calculates in Figure 2 that the top 10 stocks by market cap delivered 69% of economic profit in 2023 (with economic profit defined as return on invested capital minus the weighted average cost of capital times invested capital).
Figure 2. Economic profit of Top 10 companies by market cap vs rest of US market

Fundamentals ultimately drive valuations; value concentration has led to market cap concentration. The top 10 stocks now account for more than 25% of the market cap weight of the US stock market (Figure 3).
Yet, as the chart below demonstrates, this concentration is not historically unique. Going even further back in history, the top 10 stocks in 1900 represented 38% of the market per this analysis.
Figure 3. Stock market concentration in the US, 1950-2023

This is all another way of saying that the dispersion of returns (aka the power law) is as skewed in the public markets as in the private markets.
By buying the S&P 500, you are wittingly or unwittingly buying into a set of power law distributed assets.
Figure 4 from Goldman Sachs shows how the returns are a reflection of powerful fundamental growth (in the form of EPS), and not irrational exuberance.
Figure 4. 12 month trailing earnings per share, Magnificent 7 versus S&P 493

Again, a longitudinal study by Bessimbinder found that just 86 stocks accounted for half of all wealth creation (above Treasury bills) in the U.S. stock market going back to 1926. All of the wealth creation in that time came from just 4% of stocks (1,092 companies). 58% of stocks failed to beat T-bill returns over their lives.
Bessimbinder’s study also helps explain the success of passive index strategies, as active strategies, which tend to be less diversified, mostly underperform. If indices outperform active managers in power law distributed public markets, surely the same logic should apply to private markets?
Valuing private assets in the public markets
This brings us to the central question of how investors might value private assets in a public markets wrapper.
The combination of quality and scarcity can lead funds to trade at a premium to NAV.
Quality
As with high quality public assets, we would anticipate that high quality private assets with compelling growth stories command premium valuations.
Investors are paying for the growth rates of private companies with the potential to deliver power law outcomes. SaaStr’s Jason Lemkin recently shared this chart on the declining growth of public SaaS companies. Compare this to the AI apps growing from zero to $100m “ARR” in <2 years.
Part of the premium also derives from the fact that high quality VC-backed assets tend to be category defining businesses, meaning they are valued (on a stand alone basis), not priced (on a relative basis). SpaceX, for example, is sui generis. 🚀
And these highly valued assets drive returns. StepStone just showed a positive correlation specifically in secondaries between premium valuations and returns.
Scarcity
The sense of scarcity of access to these assets drives valuation higher still.
If we look at the top 10 private companies by reported valuation, all would be within the top 300 companies in the S&P 500 by market cap (Figure 5, excludes Chinese companies). Altimeter calls this category “quasi-public” companies.
Based on today’s market caps, SpaceX & OpenAI would be within the top 30 companies (above Coca-Cola, GE, Cisco, Salesforce, Chevron, Disney, McDonalds, Morgan Stanley, American Express, AT&T, Goldman Sachs, etc).
Figure 5. Ranking of top 10 private companies in the S&P 500 by market cap

The distinction in investors’ minds between public and private is becoming more blurred. Coatue just published the list in Figure 6 of future “Coatue Fantastic 40” companies by market cap that combines both public and private companies.
Figure 6. The Coatue Fantastic 40 based on projected 2030 market cap

Yet there are very few places that a public investor can access these private companies, which is surprising given the size of these private assets. Hence the premium paid by investors to access these quality assets.
Examples of listed VC vehicles with high quality & scarce assets
We point to two listed vehicles with private market strategies which trade at a premium to NAV, namely Destiny XYZ (~7x NAV) & Flat Capital (~2x NAV). The commonality is exposure to high profile quality US assets (as well as both being founded by CEOs of notable FinTechs).
DXYZ, set up by the founder of Forge, is aiming to build a portfolio of 100 pre-IPO companies. Of the 23 companies in their portfolio today, the SpaceX SPV represents 52% of NAV. The market clamor for SpaceX is such that DXYZ has a market cap of ~$500m, or roughly a 600%+ premium to the $70m NAV.
Flat Capital, set up by the founder of Klarna, has a portfolio of private companies including Klarna (22% of NAV) and OpenAI (7%). Flat, which trades on Nasdaq First North Growth Market in Europe, has a market cap of ~$130m which is a 88% premium to the $68m NAV.
Both entities have the added benefit to investors of immediate 100% liquidity (subject to market conditions); their structures ensure that investors can simply sell their shares without requiring any unwinding of underlying illiquid positions. DXYZ in particular has healthy trading volumes. Greater liquidity itself should support valuation.
SignalRank, which is not currently listed, believes that our Series B investments (all in preferred stock direct on cap table) today are in the brand names of tomorrow; we expect some of our portfolio to be better known by the time any future listing of SignalRank were to take place. We also anticipate higher diversification than existing private market indices, with a target portfolio of 150 companies after five years.
Structure drives valuation
A caveat here is that premia based on scarcity of access are likely to be somewhat ephemeral, as more listed vehicles come to market (and as secondary markets mature). Our argument is more that focusing on quality assets should lead to a valuation which very closely reflects NAV (or a premium to NAV).
Indeed, fund structure & valuation are becoming increasingly pertinent questions in venture. Evergreen structures are gaining ground (see Figure 7). BlackRock’s Larry Fink is looking to democratize (and ultimately tokenize) alternatives. General Catalyst is considering going public.
Figure 7. Pitchbook’s forecast of wealth-focused evergreen fund AUM, 2024-29

In terms of valuation & structure, there is a core distinction between asset owners (which tend to be valued relative to NAV) and asset managers (which tend to be valued relative to Fee Related Earnings).
SignalRank is currently valued at NAV.
We would ultimately like to be valued on a DCF.
The unpredictability of cashflow from private investments has historically impacted the valuation of listed VCs. Our long-term intention at SignalRank is to be systematic on entry and systematic on exit, with secondaries targeted at fixed periods of time for each vintage. Predictability should support more traditional (DCF) valuation methodologies.
In sum, the challenges surrounding liquidity in venture means there is greater focus on structural innovation. Our argument here is simply that a focus on quality assets will drive premium valuations.
Some final thoughts
I’d like to report a chart crime committed by JP Morgan (Figure 8.)
Figure 8. Public and private manager dispersion (based on 2015-25 returns from this report)
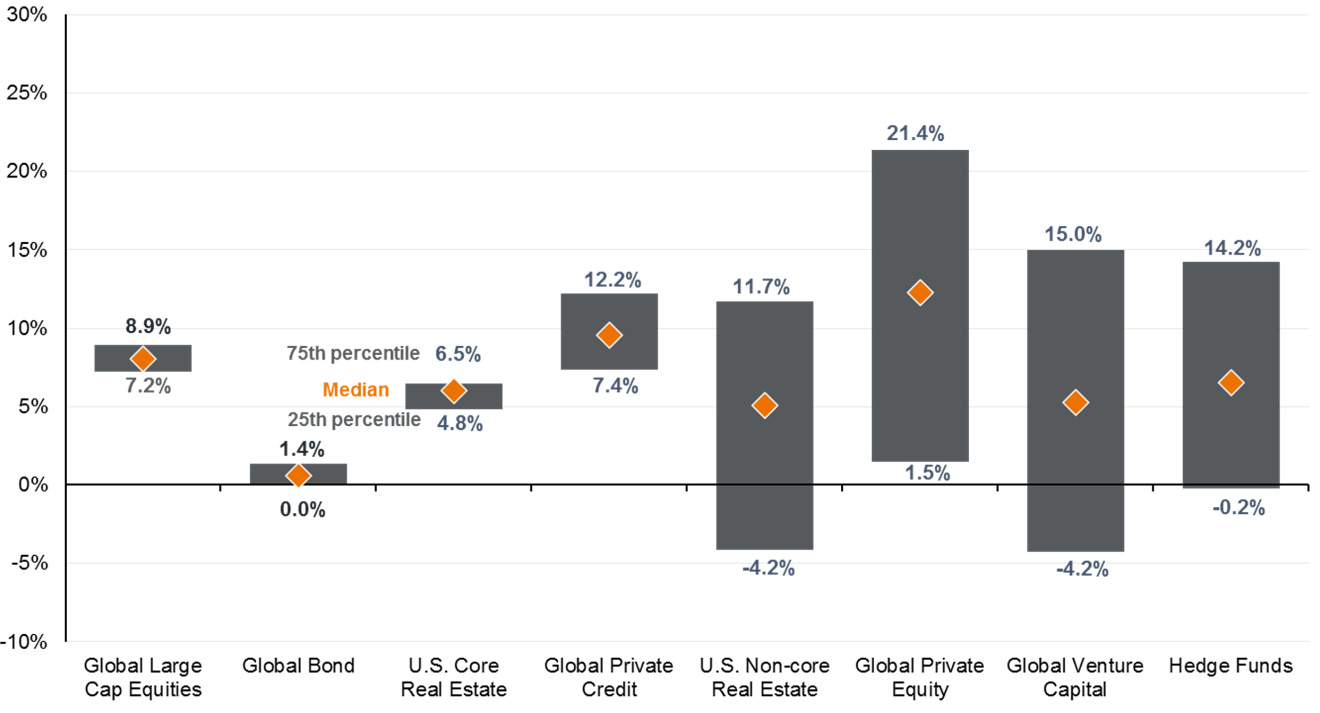
This chart does support SignalRank’s argument for indexing venture capital. It demonstrates the dispersion in returns observed across private asset classes. A diversified index (as long as it can access the top quartile) should deliver more consistent returns.
Yet the comparison to global large cap equities is misleading because the majority of public market equities are already in passive & diversified structures, so appear to exhibit a tighter band of dispersion.
We saw already how the public markets have a similar dispersion to the private markets. The above chart is not an apples to apples comparison.
An alternative chart would keep the current public market data, but replace the private market data with new private market indices which should also deliver consistent returns across more diversified portfolios…